Understanding the concept of pyramid averaging
This technique can actually separate a profit from a loss
by Vijay L Bhambwani/ DNA Money
 We have been referring to a specific style of averaging in our newsletter. Particularly for delivery-based investors who are advised to average down in pyramid style, which needs to be re-visited. The concept is interesting and for players who are digging their heels into a counter, a highly profitable one. There are times when this technique actually separates a profit from a loss. We take a closer look at what we mean by this type of averaging.
We have been referring to a specific style of averaging in our newsletter. Particularly for delivery-based investors who are advised to average down in pyramid style, which needs to be re-visited. The concept is interesting and for players who are digging their heels into a counter, a highly profitable one. There are times when this technique actually separates a profit from a loss. We take a closer look at what we mean by this type of averaging. Say you identify a stock on the basis of a bullish chart pattern and are certain of an upside target. The downside, however, remains either at less than optimal levels or is equal to the upside potential. Should you miss an opportunity just because the risk reward ratio is fairly balanced? We think not. We suggest you buy the scrip in very small lots at existing rates and average down in larger quantities so that your final acquisition price is closer to the then prevailing price. The downside would be limited and the upside will far out weigh the downside. There you are!! A possibly mediocre opportunity was converted to a winner and risks were controlled due to savvy financial discipline.
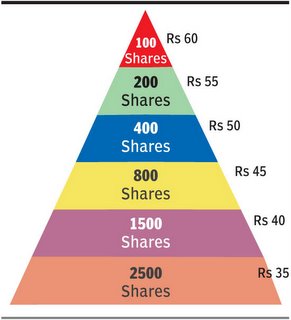
Graphically explained, the pyramid model would look like, as the name suggests - a pyramid. As the price of a security drops, your buying quantum would increase, thereby giving it the appearance of a broadening based inverted cone. Had this cone been the right side up your major acquisition would be at higher prices and averaging lower would have been in smaller lots, thereby proving to be of little help. In this case, the final acquisition cost is Rs 40 when the prevailing market price is Rs 35. The downside has clearly been controlled by a combination of fiscal management and technical analysis.
Some pros and cons:
1) This technique will work best only when there is a strong chart pattern visible on the underlying security. Triangles, saucers, head & shoulders, trend-lines, channels and cup & handle formations are typical examples of patterns that will work best with pyramid averaging.
2) While selecting scrips, for initiating this technique, keep in mind that the stock must have the potential to move back in your anticipated direction after a brief deviation (pyramids are initiated when the security is moving against your anticipated direction anyway). Essentially therefore, a high relative strength comparative (RSC - not to be confused with RSI or beta) reading on long trades and a low relative strength comparative reading on short sales must be ensured.
3) The price differential for averaging the security is very important. Too wide a gap and you are far away from equilibrium, very frequent averaging and you may wind up with a huge exposure.
4) A trader’s conviction will determine the extent of profit / loss he will finally make. If conviction fails and this strategy is abandoned half way through, it could result in a disaster.
5) This strategy is for traders with deeper pockets and ample time on hands. Short-term speculators may not derive as much benefit.
6) This technique must be applied to liquid, frontline counters with lower impact cost and higher degree of investor / trader interest. There is no point in getting stuck with a lemon! Now that you have a powerful technique at your disposal, here’s hoping your investing / trading experience is a highly profitable one! Have a profitable trade.
The author is CEO ofBsplindia.com and is a Mumbai-based investment consultant. He invites feedback at Vijay@BSPLindia.com