Value-Stock-Plus

Informed Investing!

Investing is most intelligent when it is most businesslike - Benjamin Graham (1894-1976)

____________________________________________________________________

Value-Stock-Plus stands at No. 50 in the list of Top 100 Finance Blogs  by ValueWiki

Recognised by The Economic Times as one of the most popular financial blog

Updated! Compilation on Warren Buffett, Rakesh Jhunjhunwala & Charlie Munger
____________________________________________________________________

« Home | Markets: No 'con-sensex', please! » | Even bulls and bears have a personality » | High-priced stocks can spell profits too » | Why Bulls Still Make More Money Than They Should » | Capital Goods Sector: Golden Harvest » | Accounting: Trick or treat? When numbers come up s... » | When stock market returns lie! » | Happy Holi! » | (must read!) India: Cyclical vs. Structural » | Indian Organized Retail: ‘Fair’re‘tale’ by SSKI »

Markets: Irrational exuberance

Source: DNA Money Despite warnings from leading brokerages that most Indian stocks are expensive, the Sensex continues on its northward journey. Optimists who defend the rally say that the price-earnings valuation of the Sensex is only about 20 times currently, much lower than the peak valuations in earlier rallies. That may be true, but it also needs to be noted that the PE of the Sensex is pulled down by oil and metal stocks, which trade between 7 and 14 times trailing earnings. Excluding these stocks, the Sensex PE shoots up to 26 times. But what’s wrong with a high PE, one may ask, if earnings growth is going to keep pace? For instance, if a company trades at a PE of 30 times (stock price of Rs 300 and earnings per share of Rs 10) and its earnings are expected to grow at 30%, it’s said to have a fair valuation. In this case, the company has a price-earnings/growth (PEG) ratio of 1, and a PEG of 1 or below normally means that the valuation is not high. The problem with the PEG ratio, however, is that it normally takes a short-term view of earnings growth estimates. Most times, earnings estimates are available only for the next two years, and these figures are used while calculating the PEG ratio. What would be much more useful to know is how long earnings of the company need to grow by 30% to justify a PE of 30 times. It turns out that profit would have to grow by 30% for at least 9 years to justify a PE of 30 times. This calculation is based on the assumption that the company maintains its dividend payout at 25% of profit (in order to get an incremental return on equity of 40%) for the first 10 years. Beyond the 10th year, earnings growth is assumed to be 6%, in line with the expected growth in nominal GDP 10 years hence, and dividend payout is expected to increase to 88% (again, in order to get an incremental return on equity of 40%). The dividend receipts arrived at till perpetuity, when discounted assuming a cost of equity of 14%, gives a present value of Rs 332 if growth is taken at 30% for the first 10 years, slightly higher than the stock price of Rs 300. If the period for which growth in earnings is expected to be 30% is cut to nine years, the present value comes to Rs 286 (with other assumptions such as ROE remaining the same). 
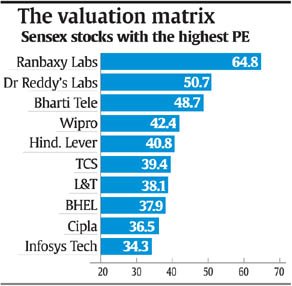
The crux of all this is that a company which currently trades at a PE of 30 times and maintains a dividend payout of about 25%, must grow earnings by 30% for the next nine years. In other words, not only are the markets building in high growth expectations into stock prices, but earnings growth is being estimated at high levels for long period of time. The table alongside shows the Sensex stocks that currently have a price-earnings ratio of 30 times. Analysts point out that for some stocks like Wipro and TCS, earnings must grow by 25% each year for at least the next 16 years, in order to justify current valuations. It needs to be noted, finally, that the above calculation gives only a broad sense of earnings expectations being built in. In the case of specific companies, different results could throw up, depending on the ROE of the particular company and assumptions on dividend payout.

Posted by toughiee on Saturday, March 25, 2006 at 6:09 PM | Permalink

The strangest thing is - it is these smae stocks .. with a higher P/E which are going up... while stocks on a lower P/E even single digit PE are sagging.

Warm Rgds
Shankar

Posted by Blogger Shankar Nath | 2:47 PM  

Post a Comment

Search


Compilations

  • Warren Buffett
  • Charlie Munger
  • Rakesh Jhunjhunwala

Previous posts

  • Markets: No 'con-sensex', please!
  • Even bulls and bears have a personality
  • High-priced stocks can spell profits too
  • Why Bulls Still Make More Money Than They Should
  • Capital Goods Sector: Golden Harvest
  • Accounting: Trick or treat? When numbers come up s...
  • When stock market returns lie!
  • Happy Holi!
  • (must read!) India: Cyclical vs. Structural
  • Indian Organized Retail: ‘Fair’re‘tale’ by SSKI

Archives

  • November 2005
  • December 2005
  • January 2006
  • February 2006
  • March 2006
  • April 2006
  • May 2006
  • June 2006
  • July 2006
  • August 2006
  • September 2006
  • October 2006
  • November 2006
  • December 2006
  • January 2007
  • February 2007
  • March 2007
  • April 2007
  • May 2007
  • June 2007
  • July 2007
  • August 2007
  • September 2007
  • October 2007
  • November 2007
  • December 2007
  • January 2008
  • February 2008
  • March 2008
  • April 2008
  • May 2008
  • June 2008

About This Blog

  • Get on Mobile
  • Atom Feeds
  • Disclaimer
  • Email to Owner

Blog Directories

  • Stockblogs

Related Blogs

  • DeepWealth
  • Dardashti
  • Ridgewood Group
  • Trading Day by Day

Business Papers

  • Economic Times
  • Business Standard
  • Business Line
  • Financial Express
  • DNA Money

Business News

  • Capital Market
  • Equitymaster
  • India Infoline
  • Moneycontrol.com
  • Yahoo! India Finance
  • ICICIdirect

Results

  • India Earnings

Quotes & Stats

  • Asian Indices
  • All Indian Quotes
  • Indian ADRs
  • Indian GDRs
  • Arbitrage
  • Sector Classification
  • FII Trends
  • MF Trends
  • NSE Heat Map
  • Insider Trading
  • BC/RD
  • BM (Company)
  • BM (Date)
  • BSE Bulk Deals
  • NSE Bulk Deals
  • NSE Block Deals
  • US Indices
  • US Pre-Market
  • US After Hours
  • CBOE VIX
  • European Indices
  • Commodity/Currency
  • Nymex Light Crude Oil
  • Nymex Natural Gas
  • Nymex Gold
  • Nymex Silver
  • Nymex Copper
  • All In One

Equity Analysis

  • Kotak Street
  • Moneypore
  • Geojit
  • IDBI
  • Naviamarkets
  • ET Big Bucks
  • BS Smart Investor
  • FE Investor
  • BL Investment World

Screeners

  • Equitymaster
  • ICICIdirect

Research Reports

  • Moneycontrol

Technical Analysis

  • ICICIdirect
  • Yahoo! Finance

E-Books

  • Value Investing
  • Trading & Technicals
  • Gann
  • Elliott Wave
  • Risk Management
  • Derivatives

Misc. Links

  • BSE
  • NSE
  • SEBI
  • SEBI Edifar
  • Corp. Filings
  • WatchOutInvestors

Global Research

  • Morgan Stanley GEF
  • Hussman Funds

Interactive

  • Online Chat
Subscribe to this blog's feed
[What is this?]
Powered by Blogger