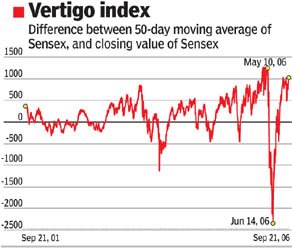
 The theory of reversion to the mean suggests that the Bombay Stock Exchange Sensex should see some kind of correction soon. According to the hypothesis, the more the moving average of the Sensex shifts away from the index’s closing value as on that date, the sharper will be its drop.
We took Sensex data for the past five years and plotted the difference between the 50-day moving average and the index itself. The chart indicates that this difference was at its highest, at approximately 1,250 points, when the Sensex peaked on May 10, 2006. The decline was steep from there, with 3,683 points getting shaved off the index in just 25 trading sessions.
In the last five years, there hasn’t been such a large gap between the moving average of the index and its closing value. Which brings us to more recent weeks. Since mid-August 2006, there have been four days when the difference has been over 1,000 points, including last Thursday, when it was 1,005 points. Technical analysts are a tad worried, because if one discounts May, 2006, the difference has never been so large.
Recent data also indicate that foreign institutional investors (FIIs) have been buying in the cash market and selling futures. In September, they have been net buyers by Rs 3,691 crore in the former and net sellers by Rs 3,413 crore in the latter. But analysts say that this cash market buying could be a temporary phenomenon, since they seem to be using these stockmarket operations to short the dollar against the rupee by proxy in the belief that the rupee will strengthen. If this latter trend reverses, the FIIs could change tack as well.
Source: DNA Money
Additional Readings:
Off-Topic Readings:
Parting Thought:
 The theory of reversion to the mean suggests that the Bombay Stock Exchange Sensex should see some kind of correction soon. According to the hypothesis, the more the moving average of the Sensex shifts away from the index’s closing value as on that date, the sharper will be its drop.
Any Specific reason for using 50 day instead of any other MA.
Cheers
Prashanth
Posted by Anonymous |
9:31 PM
using arithematic point moves in sensex is non right when comparing with moving average.
the author should have used % moves away from the 50 ma to make the picture worth while.
for example.
a 5% move from 50 ema at say 3000 is only 150 points.
while the same when index is at 12000 is 600 points.
the idea is 150 and 600 have same effect since they are 5% only.
Posted by Rajeev mundra |
8:21 PM
hahahaha...what a bunch of nonsense...
may i suggest you all read Fooled by Randomness by Nicholas Nassim Taleb
the funny thing abt the stock markets is that it helps one validate any theory even if its for a short while.
Posted by J |
3:04 PM